How to Value a Young SaaS Without 12 Months of Revenue
A marketplace multiple can look precise while being based on incomplete or unstable financial data. Here is how to evaluate a young SaaS with less than twelve months of history.

The Marketplace Multiple Looked Accurate
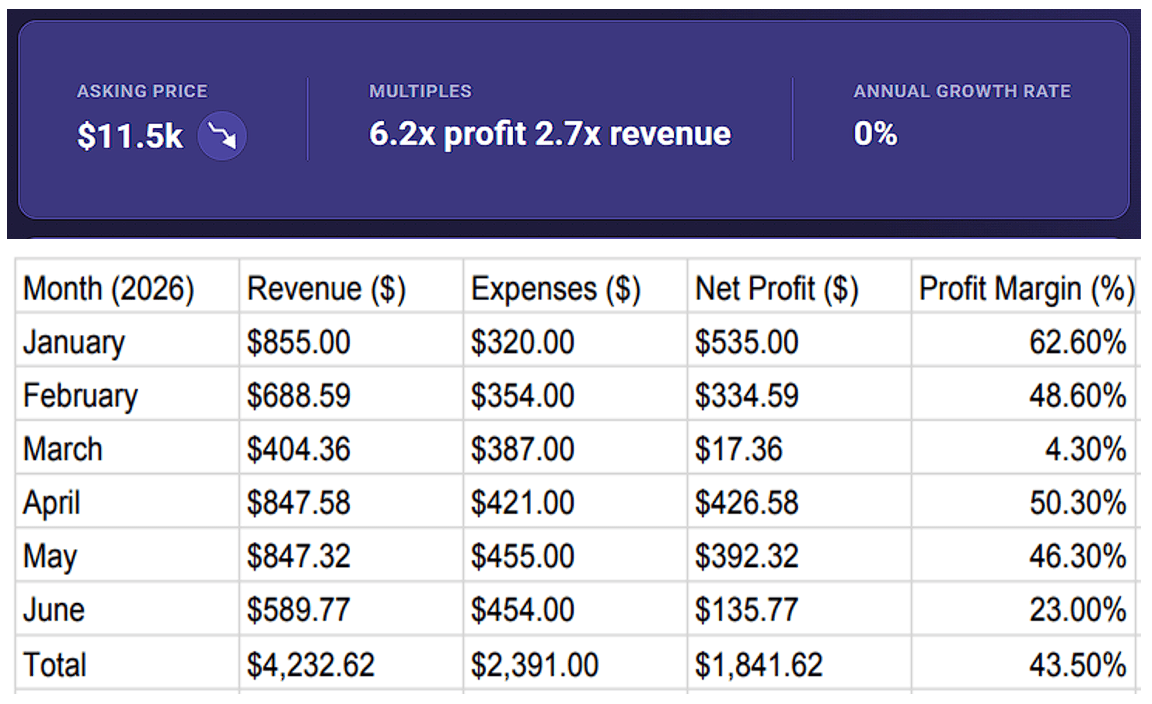
I recently reviewed a SaaS listed for $11,500. The marketplace showed a 2.7x revenue multiple and a 6.2x profit multiple. At first glance, those numbers made the business look easy to evaluate. Revenue multiple. Profit multiple. Asking price. Nice and organized. There was just one problem. The company had launched in January and only had six months of financial history. The “TTM” numbers were not really trailing twelve months. They were closer to life-to-date results placed inside the typical valuation format. The calculations looked good, but marketplace multiples should not be taken at face value. That does not automatically make a young SaaS a bad acquisition. Every company has to start somewhere. It does mean the headline multiple should not be trusted until you understand what numbers went into it.
What the Financials Actually Showed
During its first six months, the business generated:
- $4,232.62 in revenue
- $1,841.62 in profit
- $705 in average monthly revenue
- $307 in average monthly profit
The Monthly Results Were Unstable
Those averages sound respectable for an early-stage micro-SaaS. But averages can become dangerous when the monthly results are unstable.
- January — Revenue: $855 | Profit: $535
- February — Revenue: $689 | Profit: $335
- March — Revenue: $404 | Profit: $17
- April — Revenue: $848 | Profit: $427
- May — Revenue: $847 | Profit: $392
- June — Revenue: $590 | Profit: $136
The Average Did Not Represent a Stable Run Rate
The business did not gradually grow toward $705 per month. Revenue fell, recovered, and then fell again. Monthly profit ranged from $17 to $535. June revenue was about 30% lower than May. Profit fell by roughly 65%. That makes the six-month average much less useful than it first appears. The business averaged $307 per month in profit, but it had not yet established a reliable monthly run rate. That is a big deal during an acquisition. It can be the difference between buying predictable cash flow and buying six months of financial mood swings.
Why the Advertised Multiple Was Misleading
The marketplace calculated its multiples by dividing the asking price by the company’s first six months of results. The math looked something like this:
- $11,500 divided by roughly $4,247 in revenue equals 2.7x
- $11,500 divided by roughly $1,856 in profit equals 6.2x
The Math Worked, but the Comparison Did Not
The calculation works. The comparison does not. A normal annual profit multiple compares the purchase price with approximately twelve months of earnings. Here, the asking price was being divided by only six months of profit. That makes the profit multiple appear much higher than it would on an annualized basis.
What Annualizing the Results Produced
If you extend the first six months across a full year by doubling them, a process called annualizing, the business produces approximately:
- $8,465 in annualized revenue
- $3,683 in annualized profit
- A 1.36x annualized revenue multiple
- A 3.12x annualized profit multiple
Annualization Created a New Problem
That sounds much more reasonable. But annualization creates a new problem. It assumes the next six months will look like the first six. With June profit at only $136, that assumption is doing Olympic-level lifting.
The Same Asking Price Created Three Different Deals
The valuation changed dramatically depending on which monthly result I used.
- Six-month average — Monthly profit: $307 | Approximate payback: 37 months
- June actual — Monthly profit: $136 | Approximate payback: 85 months
- Listing’s claimed latest month — Monthly profit: $598 | Approximate payback: 19 months
The Payback Period Changed With Each Assumption
At the six-month average, it would take a little over three years to recover the purchase price before taxes, financing costs, or additional investment. At June’s performance, the payback period stretches to roughly seven years. At the listing’s claimed $598 monthly profit, the deal starts looking much more attractive.
The Latest Profit Figure Needed an Explanation
There was another issue, though. The uploaded profit-and-loss statement did not include a month with $598 in profit. The strongest documented month produced $535. I’m not saying the seller was lying, but the numbers might have gotten a little touch-up before hitting the listing. Before valuing the company, I would need the seller to explain which number was current and where it came from. You cannot confidently apply a multiple when the starting number is still wandering around unsupervised.
Revenue Quality Mattered Too
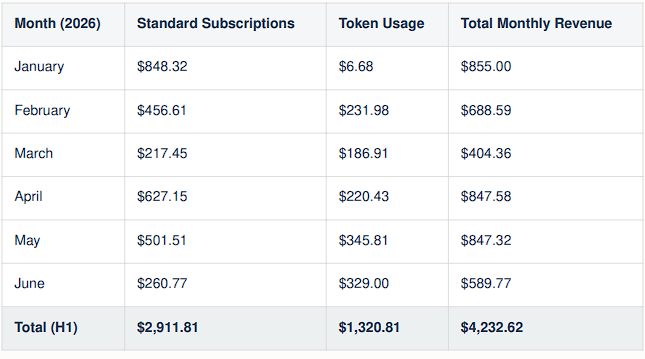
The business earned money from both subscriptions and token purchases. During the first six months:
- Subscriptions generated $2,911.81
- Token purchases generated $1,320.81
- Tokens represented approximately 31% of total revenue
Token Revenue Became More Important by June
By June, token revenue had grown to $329, while standard subscription revenue had fallen to $260.77. Token revenue is not automatically bad. It could be valuable repeat usage revenue. The problem is that it is not as predictable as subscription revenue until you understand customer behavior.
Repeat Usage Is Not Always Recurring Revenue
Thirty customers buying tokens every month creates a repeatable revenue stream. One customer buying a giant token package before disappearing into the night does not deserve the same valuation. A buyer should separate:
- Recurring subscription revenue
- Repeat usage revenue, such as customers purchasing additional tokens
- One-time purchases, such as token packages
- Promotional revenue
- Launch-related spikes
Not Every Revenue Dollar Deserves the Same Valuation
They may all count as revenue. But they should not all be treated equally. Subscription revenue that repeats automatically is usually easier to forecast than occasional usage purchases. Token revenue can still be valuable, but the buyer needs to determine how often customers return, how concentrated the purchases are, and whether the behavior is likely to continue after the acquisition.
How I Would Value a Young SaaS:
When a company has less than twelve months of history, I would not rely on one annualized number. I would create three scenarios.
Conservative Case
Use the most recent weaker months. This helps estimate what the business may produce if the decline continues or revenue remains flat.
Base Case
Use a weighted average that gives more importance to recent performance than early launch months. The most recent three months usually tell you more about the current business than the first three.
Optimistic Case
Use the stronger historical months, but only when there is evidence they can be repeated. That evidence might include:
- Consistent traffic
- Working customer acquisition channels
- Improving retention
- Repeat token purchasing behavior
- A clear explanation for the recent decline
Compare the Asking Price With All Three Scenarios
The business should be evaluated under the conservative, base, and optimistic cases. If the deal only works under the optimistic case, it probably does not have much margin for error. A buyer should know whether the purchase still makes sense when performance is merely average, not only when every future assumption goes right.
The Lesson
A multiple is the final step in valuation, not the first. Before multiplying revenue or profit, determine whether the number is current, stable, recurring, transferable, and likely to continue. Young SaaS businesses are especially difficult to value because they have not existed long enough to prove what a normal year looks like. Six months of revenue can show potential. It cannot automatically establish a reliable run rate. The most important question is not, “What multiple is the seller asking?” It is, “What level of profit is likely to remain after I own the business?” Until you can answer that, the marketplace multiple is just a neat-looking number sitting on top of an unfinished analysis.